The Protein Data Bank and protein 3D visualization.
In my tutorial A general overview of the protein structure, I explain that the primary structure of a protein consists of a sequence of amino acids, folding locally into secondary structures such as alpha helices, beta-strands, and turns, that two or three adjacent secondary structures might combine into common local folds called " motifs" or "supersecondary" structures such as beta sheets or alpha-alpha units, and that these building blocks then fold into the tertiary structure of the protein (note, that sometimes, one or more tertiary structures may be combined as subunits into a quaternary structure). The tertiary structure of a protein is what the protein really looks like, how its amino acids (and the atoms of these) are located the one relative to the others, in other words, it's the real-world three-dimensional (3D) structure of the protein.
Knowing the amino acids sequence and how these fold to form an alpha helix, beta-strand, etc is generally not enough to understand what a protein does, or how it does it. Even if we know that the protein is implicated in a given disease, knowledge of its tertiary structure is usually needed to find a possible treatment. Knowing the 3D structure of proteins is thus essential. Not only that these structures have to be determined, but also the related data must be collected and stored at a place where scientists and researchers can easily access it. The main source for information about 3D structures of macromolecules (in particular proteins, but also nucleic acids and carbohydrates) is the Protein Data Bank (PDB).
There are several methods that may be used to determine the structure of a protein (X-ray crystallography and nuclear magnetic resonance spectroscopy, as well as computational methods like homology modeling and deep learning-based approaches). Each method has advantages and disadvantages. In each of these methods, the scientist uses many pieces of information to create the final atomic model. In most cases, this experimental information is not sufficient to build an atomic model from scratch. Additional knowledge about the molecular structure must be added. Globally, it's a balanced mixture of experimental observation and knowledge-based information that allows the scientist to build a model that is consistent with both the experimental data and the expected composition and geometry of the molecule. For details concerning the different structure determination methods, please, have a look at the article Methods for Determining Atomic Structures at the PDB website.
When a researcher has determined a new protein structure, they can upload the structure data to the Protein Data Bank. The main steps to take to do so are the following:
- Preparation of the data: The protein structure data, together with other information concerning the protein, has to be written to a file in a specific format; the format actually used by the PDB is called PDBx/mmCIF.
- Validation of the data: The data has to be validated by the wwPDB Validation Server, in order to ensure that it is accurate and consistent
- Submission of the data: This is done using the wwPDB OneDep system.
"The PDBx/mmCIF file format and data dictionary is the basis of wwPDB data deposition, annotation, and archiving of PDB data from all supported experimental methods. This format overcomes limitations of the legacy PDB file format and supports data representing large structures, complex chemistry, and new and hybrid experimental methods. The legacy PDB file format is no longer modified or extended to support new content. As the PDBx/mmCIF format continues to evolve, PDB format files will become outdated.", you can read in the article Beginner’s Guide to PDB Structures and the PDBx/mmCIF Format at the PDB website. However (at least I suppose so), most (and probably nearly all) data is still available as PDB files, (most) bioinformatics software continues to support the PDB format. Anyway, all example files in this tutorial use the legacy PDB format...
Downloading PDB files from the Protein Data Bank.
The Protein Data Bank (PDB) at Brookhaven National Laboratory, is a database containing experimentally determined three-dimensional structures of proteins, nucleic acids and other biological macromolecules. The archives contain atomic coordinates, citations, primary and secondary structure information, crystallographic structure experimental data, as well as hyperlinks to many other scientific databases. Scientists around the world contribute structures to the PDB and use it on a daily basis. The common interest shared by this community is a need to access information that can relate the biological functions of macromolecules to their three-dimensional structures.
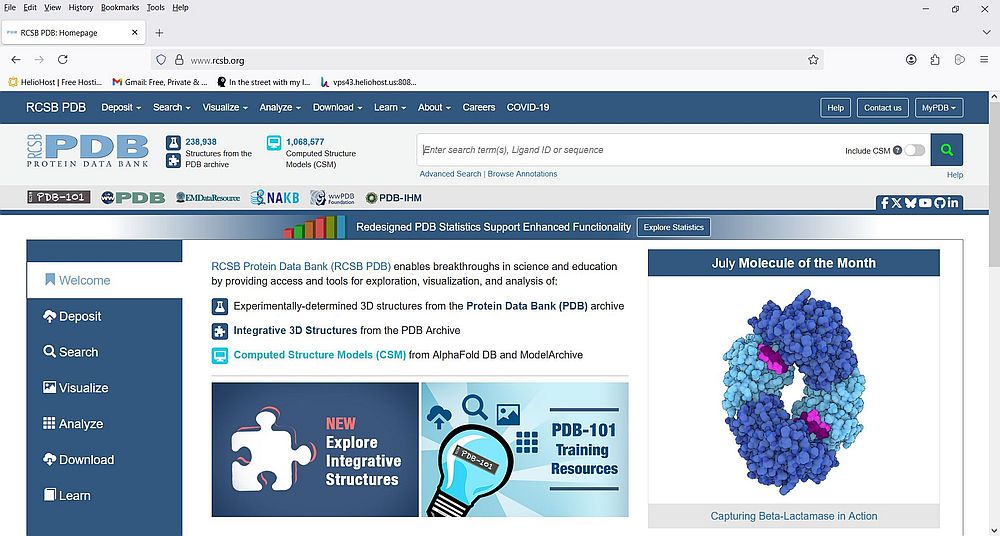
PDB is a public database, what means that everyone (including you and me) may access it to search, analyze, visualize, and download data. The screenshot below shows the homepage of the Protein Data Bank at https://www.rcsb.org/
 |
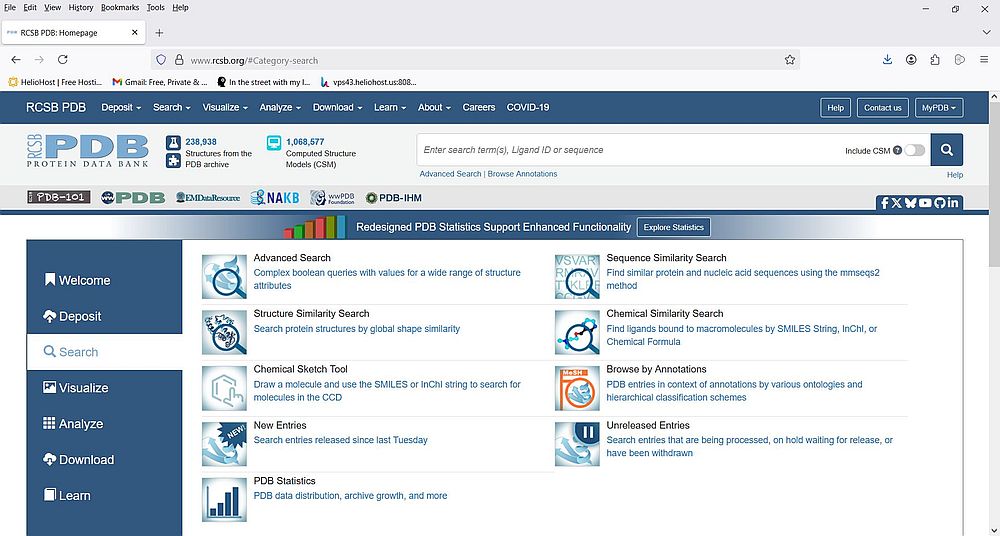
If you choose Search from the vertical navigation bar, you come to a page, where you can can choose how you want your search to be done. There are a lot of possibilities, including advanced search, browsing by annotation, structure, sequence and chemical similarity search. It's obvious that describing these methods is outside the scope of this tutorial. Two articles at the PDB site that you should consider to read: Basic Search, and Overview: Advanced Search.
 |
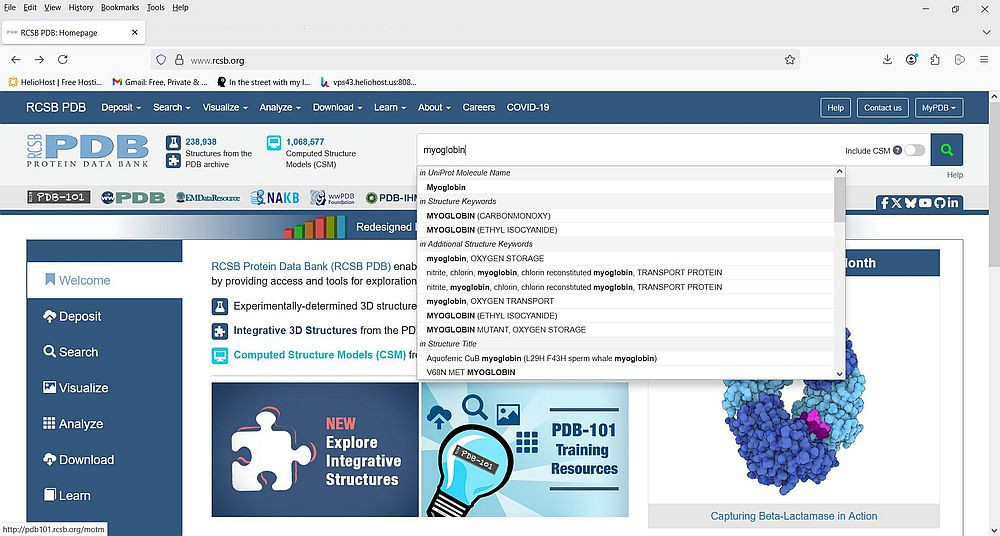
Every experimental structure in the PDB is assigned a 4-character alphanumeric identifier called the PDB identifier (PDB ID). Knowing this ID is, of course, the best way to find the data for a given protein. But, searching by name is probably the simplest way in most cases. As example, let's try to find the structural data of human myoglobin (a protein that stores oxygen in muscle tissue). We can do this without going to the "Search" page. Just enter the word "myoglobin" in the search box on the PDB homepage. This corresponds to searching the entire PDB database for the text "myoglobin", and the items available will be displayed as a drop-down list, from which we can choose an item.
 |
From the list, let's choose the "Myoglobin" item mentioned under Uniprot/Molecule name. The screenshot shows the search result: 531 structures found (displayed by 25 per page).
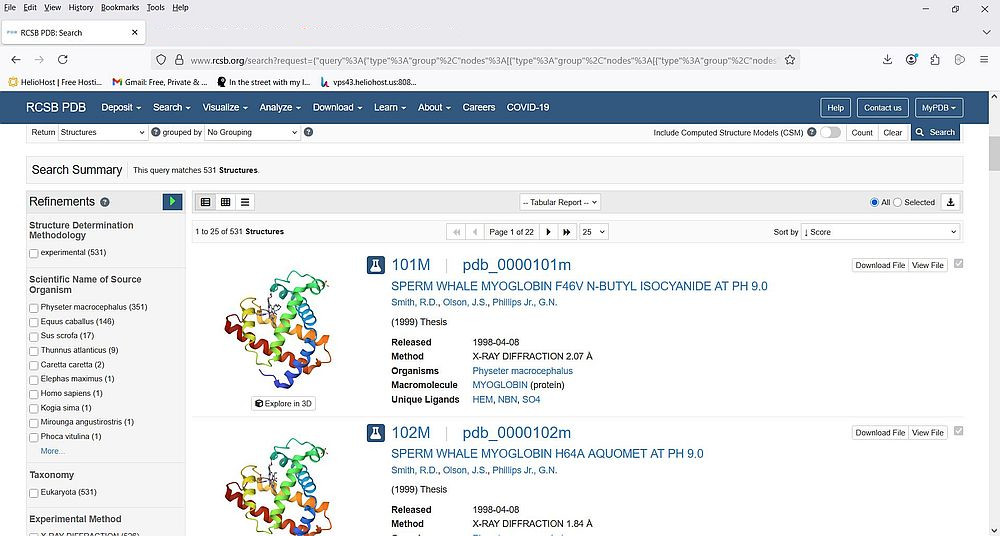 |
The left side of the page displays a whole bunch of possibilities to refine the search. One of these refinements is Scientific name of source organism. As we search for human myoglobin, let's select the checkbox near Homo sapiens. Note the "(1)" written behind this list item: it indicates that there is one single structure available. To apply the new search criteria, click the blue triangle at the right of "Refinements" (list title). As expected, there is a single search result: the human myoglobin structure with PDB ID "3RGK".
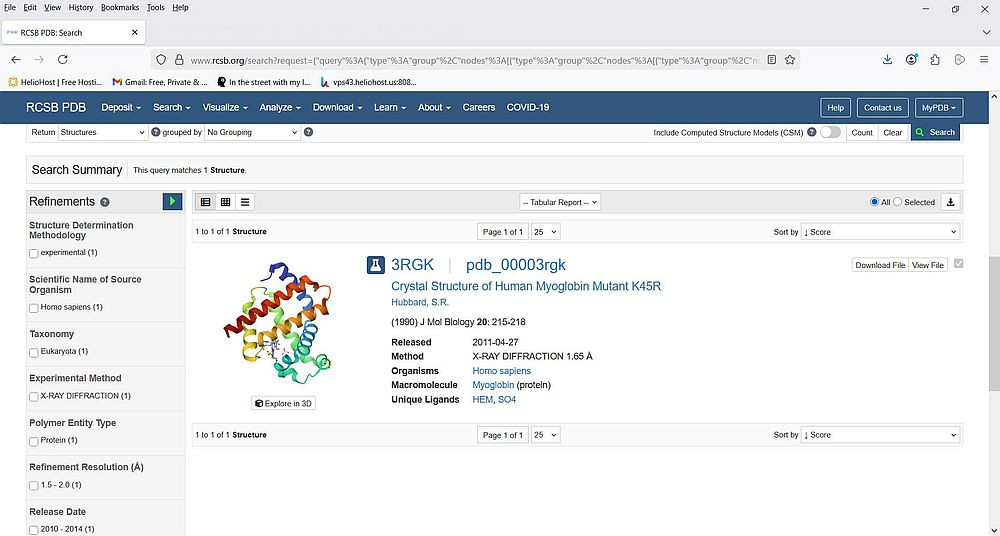 |
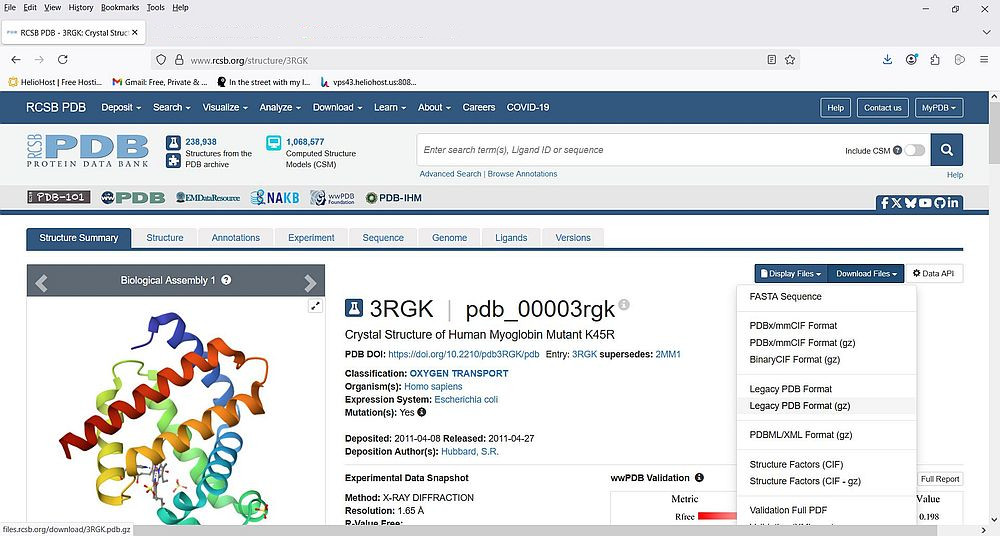
When you click the PDB ID link, you get to the details page for this molecule. Here you can find information about the structure, the experiment, the sequence, the genome, and others. At the top-right corner, you find buttons that open drop-down lists to display resp. to download the molecule related files. If you expand the Download files list, you can see several download possibilities, among which we have: download the molecule sequence as FASTA file (cf. my tutorials Biological sequences and genetic code primer and A general overview of the protein structure), download the molecule structure data as PDBx/mmCIF file (packed into a tar.gz or not), download the molecule structure data as PDB file (packed into a tar.gz or not). I downloaded the packed version of the PDB file (filename: 3rgk.pdb.gz).
 |
Besides the human myoglobin molecule (3rgk), the tutorial also uses the human insulin molecule (3i40). Thus, you should also download the file 3i40.pdb.gz
Note: If you don't succeed to open the tar.gz archive, download the freeware application 7-Zip.
Introduction to the PDB file format.
PDB files (extension .pdb, sometimes .ent) are the legacy way of storing data concerning experimentally determined three-dimensional structures of biological macromolecules at Protein Data Bank. The data contained in these files include atomic coordinates, crystallographic structure factors and NMR experimental data. Aside from coordinates, they also include the names of molecules, primary and secondary structure information, sequence database references, where appropriate, and ligand and biological assembly information, details about data collection and structure solution, and bibliographic citations.
PDB files are 80 columns text files, organized in records, identified by a record name that is left-justified in columns 1 - 6 of each line, and followed by a blank. Records are subdivided into fields with defined starting column and defined length (number of characters). Some records are mandatory, others are optional, but they must always appear in a defined order. A given record may appear a single time, or several times (depending on the record). They may be one single line, or several lines records (depending on the record). Multiple line records are records that have an information content that exceeds the number of columns available. They are therefore continued on subsequent lines. The second and subsequent lines must contain a two-character continuation field, which is a right-justified integer. This number is incremented by one for each additional line of the record, and is followed by a space.
Each PDB file starts with a HEADER record. This record's format is as follows:
| Columns | Data type | Field content |
|---|---|---|
| 1 - 6 | Record name | HEADER |
| 11 - 50 | String(40) | Molecule classification |
| 51 - 59 | Date | Coordinates deposition date |
| 63 - 66 | IDcode | PDB identifier |
Example:
12345678901234567890123456789012345678901234567890123456789012345678901234567890
HEADER HORMONE 01-JUL-09 3I40
The TITLE record is normally the second (sometimes the third) record in the file. This record may span over several lines; its format is as follows:
| Columns | Data type | Field content |
|---|---|---|
| 1 - 6 | Record name | TITLE |
| 9 - 10 | Continuation | Line continuation value |
| 11 - 80 | String | Title of the experiment or analysis |
Example:
12345678901234567890123456789012345678901234567890123456789012345678901234567890
TITLE CRYSTAL STRUCTURE OF THE WILD-TYPE HETEROCOMPLEX BETWEEN COIL 1B
TITLE 2 DOMAINS OF HUMAN INTERMEDIATE FILAMENT PROTEINS KERATIN 1 (KRT1) AND
TITLE 3 KERATIN 10 (KRT10)
The COMPND record describes the macromolecular contents of an entry. Even though there may be several components (molecules), the record appears only once in the file. The record format is as follows:
| Columns | Data type | Field content |
|---|---|---|
| 1 - 6 | Record name | COMPND |
| 9 - 10 | Continuation | Line continuation value |
| 11 - 80 | Specification list | Description of the molecular components |
A specification list is a sequence of specifications, separated by semi-colons (;). Each specification is made of a defined token/value pair, separated by a colon (:). The major tokens are: MOL_ID, that numbers each component; MOLECULE, the molecule name; CHAIN, the chain identifier, or a comma-separated list of chain identifiers.
Example:
12345678901234567890123456789012345678901234567890123456789012345678901234567890
COMPND MOL_ID: 1;
COMPND 2 MOLECULE: INSULIN A CHAIN;
COMPND 3 CHAIN: A;
COMPND 4 ENGINEERED: YES;
COMPND 5 MOL_ID: 2;
COMPND 6 MOLECULE: INSULIN B CHAIN;
COMPND 7 CHAIN: B;
COMPND 8 ENGINEERED: YES
The SOURCE record describes the biological and/or chemical source of each biological molecule in the entry. As for COMPND, the record appears only once in the file. The record format is as follows:
| Columns | Data type | Field content |
|---|---|---|
| 1 - 6 | Record name | SOURCE |
| 9 - 10 | Continuation | Line continuation value |
| 11 - 79 | Specification list | Source of the macromolecule |
The major tokens are: MOL_ID, that numbers each component (same values as appear in COMPND); ORGANISM_SCIENTIFIC, the scientific name of the organism; ORGANISM_COMMON, the common name of the organism; ORGANISM_TAXID, the NCBI Taxonomy ID number of the organism.
Example:
12345678901234567890123456789012345678901234567890123456789012345678901234567890
SOURCE MOL_ID: 1;
SOURCE 2 ORGANISM_SCIENTIFIC: HOMO SAPIENS;
SOURCE 3 ORGANISM_COMMON: HUMAN;
SOURCE 4 ORGANISM_TAXID: 9606;
SOURCE 5 EXPRESSION_SYSTEM: ESCHERICHIA COLI;
SOURCE 6 EXPRESSION_SYSTEM_TAXID: 562;
SOURCE 7 MOL_ID: 2;
SOURCE 8 ORGANISM_SCIENTIFIC: HOMO SAPIENS;
SOURCE 9 ORGANISM_COMMON: HUMAN;
SOURCE 10 ORGANISM_TAXID: 9606;
SOURCE 11 EXPRESSION_SYSTEM: ESCHERICHIA COLI;
SOURCE 12 EXPRESSION_SYSTEM_TAXID: 562
Note: NCBI (National Center for Biotechnology Information) provides a wealth of information in the fields of medicine and biological sciences. They host (public) databases concerning literature, health, genomes, genes, proteins, chemicals. NCBI homepage: http://www.ncbi.nlm.nih.gov/
The EXPDTA record identifies the experimental technique used. The record format is as follows:
| Columns | Data type | Field content |
|---|---|---|
| 1 - 6 | Record name | EXPDTA |
| 9 - 10 | Continuation | Line continuation value |
| 11 - 79 | SList | The experimental technique(s) with optional comment describing the sample or experiment |
A SList is a String that is composed of text separated with semi-colons (;).
Example:
12345678901234567890123456789012345678901234567890123456789012345678901234567890
EXPDTA X-RAY DIFFRACTION
The DBREF record provides cross-reference links between PDB sequences (what appears in the SEQRES record) and a corresponding sequence in one of the "big" sequence databases. This record has actually a standard format, that is extended in the case where the information to be entered into these fields doesn't fit. This record may appear several times, in fact once for each molecule chain (cf. COMPND record). The record has more than a dozen of fields, among them the PDB ID (columns 8 - 11), the chain identifier (column 13), the sequence database name (columns 27 - 32), the sequence database accession code (columns 34 - 41).
Sequence database names appear as abbreviations: PDB = Protein Data Bank, GB = GenBank, UNP = UNIPROT, NORINE = Norine.
Example:
12345678901234567890123456789012345678901234567890123456789012345678901234567890
DBREF 3I40 A 1 21 UNP P01308 INS_HUMAN 90 110
DBREF 3I40 B 1 30 UNP P01308 INS_HUMAN 25 54
These records describe the A and B chains of human insulin (PDB ID: 3I40). The sequence database referenced is UNIPROT, where the sequences may be accessed using the ID: P01308.
The SEQRES record contains a listing of the consecutive chemical components covalently linked in a linear fashion to form a polymer. In most cases, this mostly corresponds to the primary structure of a protein or a nucleic acid. These records span, of course, over multiple lines. They may also appear several times; in fact, there is a record for each chain of the molecule. Besides the amino acids/base codes (and the record name), there are three other fields, one identifying the chain, another containing a serial number of the SEQRES record for the current chain (Starting at 1 and incremented by one each line; reset to 1 for each chain), and finally the number of residues in the chain (must be repeated in each line). Record format:
| Columns | Data type | Field content |
|---|---|---|
| 1 - 6 | Record name | SEQRES |
| 8 - 10 | Integer | Serial number of the SEQRES record for the current chain |
| 12 | Character | Chain identifier |
| 14 - 17 | Integer | Sequence length (number of residues) |
| 20 - 22 | Residue Name | Amino acid/base code |
| 24 - 26 | Residue Name | Amino acid/base code |
| 64 - 66 | Residue Name | Amino acid/base code |
| 68 - 70 | Residue Name | Amino acid/base code |
For proteins, the codes are the 3-letter IUB/IUPAC amino acid codes (cf. my tutorial Biological sequences and genetic code primer). For nucleic acids, a difference is made between DNA and RNA, the first one using the 2-letter codes DA, DC, DG, DT and DI, whereas the second one use the standard 1-letter codes A, C, G, U and I.
Note: The non-standard base code I stands for inosine, a nucleoside that is formed when hypoxanthine is attached to a ribose ring via a β-N9-glycosidic bond. Inosine is commonly found in tRNAs and is essential for proper translation of the genetic code in wobble base pairs.
Example:
12345678901234567890123456789012345678901234567890123456789012345678901234567890
SEQRES 1 A 21 GLY ILE VAL GLU GLN CYS CYS THR SER ILE CYS SER LEU
SEQRES 2 A 21 TYR GLN LEU GLU ASN TYR CYS ASN
SEQRES 1 B 30 PHE VAL ASN GLN HIS LEU CYS GLY SER HIS LEU VAL GLU
SEQRES 2 B 30 ALA LEU TYR LEU VAL CYS GLY GLU ARG GLY PHE PHE TYR
SEQRES 3 B 30 THR PRO LYS ALA
Secondary structure records (without details):
- HELIX records are used to identify the position of helices in the molecule. Helices are named, numbered, and classified by type. The residues where the helix begins and ends are noted, as well as the total length.
- The SHEET records are used to identify the position of sheets in the molecule. Sheets are both named and numbered. The residues where the sheet begins and ends are noted.
Without giving the details, here are some other records, that may appear in PDB fields:
- MODRES records provide descriptions of modifications (e.g., chemical or post-translational) to protein and nucleic acid residues.
- HET records are used to describe non-standard residues, such as prosthetic groups, inhibitors, solvent molecules, and ions for which coordinates are supplied. They are used together with HETNAM and HETSYN records.
- FORMUL records present the chemical formula and charge of a non-standard group.
The ATOM records present the atomic coordinates for standard amino acids and nucleotides. They also present the occupancy and temperature factor for each atom. Non-polymer chemical coordinates use the HETATM record type. Record format:
| Columns | Data type | Field content |
|---|---|---|
| 1 - 6 | Record name | ATOM |
| 7 - 11 | Integer | Atom serial number |
| 13 - 16 | Atom | Atom name |
| 17 | Character | Alternate location indicator |
| 18 - 20 | Residue Name | Amino acid/base code |
| 22 | Character | Chain identifier |
| 23 - 26 | Integer | Residue sequence number |
| 27 | AChar | Code for insertion of residues |
| 31 - 38 | Real(8.3) | Orthogonal coordinates for X in Angstroms |
| 39 - 46 | Real(8.3) | Orthogonal coordinates for Y in Angstroms |
| 47 - 54 | Real(8.3) | Orthogonal coordinates for Z in Angstroms |
| 55 - 60 | Real(6.2) | Occupancy |
| 61 - 66 | Real(6.2) | Temperature factor |
| 77 - 78 | LString(2) | Element symbol (right-justified) |
| 79 - 80 | LString(2) | Charge of the atom |
AChar is an alphabetic character. LString is like String, except that all spacing is significant and must be preserved.
Example:
12345678901234567890123456789012345678901234567890123456789012345678901234567890
ATOM 1 N GLY A 1 -27.279 6.238 -12.314 1.00 45.01 N
ATOM 2 CA GLY A 1 -26.249 6.028 -11.313 1.00 43.47 C
ATOM 3 C GLY A 1 -25.582 4.677 -11.471 1.00 34.37 C
ATOM 4 O GLY A 1 -25.731 4.023 -12.501 1.00 30.09 O
ATOM 5 N ILE A 2 -24.853 4.248 -10.446 1.00 32.71 N
...
There are further records, in particular a whole bunch of REMARK records, that are used together with other records. For a detailed description of the legacy PDB format (all records, with examples), you can download the Atomic Coordinate Entry Format Description as PDF from the PDB website.
As I said at the beginning of the tutorial, the PDB format is legacy and has been replaced by PDBx/mmCIF. To have an idea, what our records look like with the new format, have a look at the article PDB to PDBx/mmCIF Data Item Correspondences at the PDB site.
The primary information stored in the files of the Protein Data Bank is a list of the molecule's atoms and their 3D location in space. To learn more about this topic, the article Dealing with Coordinates might be helpful.
To terminate this section, let's have a look of the human myoglobin file that we downloaded before. The screenshots show the file 3rgk.ent, opened in Notepad++.
![Protein Data Bank: Content of the file 3rgk.ent (human myoglobin) [1] Protein Data Bank: Content of the file 3rgk.ent (human myoglobin) [1]](../screenshots/pdb6a.jpg) |
![Protein Data Bank: Content of the file 3rgk.ent (human myoglobin) [2] Protein Data Bank: Content of the file 3rgk.ent (human myoglobin) [2]](../screenshots/pdb6b.jpg) |
Parsing PDB files with Perl.
This section is obviously for people with programming knowledge. If you don't know about the Perl programming language, or want to skip this section for whatever other reason, click the following link to jump to Visualizing 3D molecule structures.
As PDB files have a defined structure as well concerning the sequence of the different records as concerning the record content, an intermediate Perl programmer should be able to write parsing routines to filter out what ever they need. There are also example scripts available on the Internet. Chapter 11 of the O'Reilly book Beginning Perl for Bioinformatics is dedicated to the extraction of information from PDB files; you can find the PDF version of the book on the net.
However, there is no necessity to do all by hand. The Hirst Group at University of Nottingham has developed the Perl module ParsePDB, that you can download from the nottingham.ac.uk website. The download file is called ParsePDB.zip, and contains the Perl module ParsePDB.pm and the user manual in PDF format. Be sure to also download the module Error.pm, that is required to use the functions of ParsePDB.pm.
To use the module, place ParsePDB.pm and Error.pm together with your scripts. Be sure to tell Strawberry Perl to look in the current directory when searching for modules.
You can do this by using the following shebang line (supposing Perl is installed in C:\Programs\Strawberry\win64):
#!C:/Programs/Strawberry/win64/perl/bin/perl.exe -I.
In the following paragraphs, I'll show some simple Perl scripts working with PDB files. The scripts have been tested on Windows 10 with Strawberry Perl 5.32.1, 64-bit. Click the following link to download the Perl source code of all tutorial program samples (plus the molecules used in the tutorial) from my site.
Before you start using ParsePDB.pm, open the module in your Perl editor, and scroll down to line 409, where you find the code
if (not defined @{$self->{Content}}) { $self->Read (ParsePDB => 0) }
that you have to replace by something like
unless (@{$self->{Content}}) { $self->Read (ParsePDB => 0) }
Otherwise your scripts will abort with the error message Can't use 'defined(@array)'.
Sample script 1: PDB file statistics.
The script pdb1.pl parses the PDB file with the filename entered as command line argument, and prints out the number of experimental models, and for the first model (ignoring all others if there should be; this is actually done, for simplicity, in all 4 scripts), the number of chains, the total number of residues, and the total number of atoms.
ParsePDB is object oriented and the first step to take is to create a new ParsePDB object:
$PDB = ParsePDB->new (FileName => $fileName);
$PDB = ParsePDB->new (FileName => $fileName, NoANISIG => 1);
The second evocation of the constructor filters out the SIGATM, SIGUIJ and ANISOU lines before parsing the file. The data of these "special characteristics" atom
descriptions are normally not needed, and just increase the parsing time.
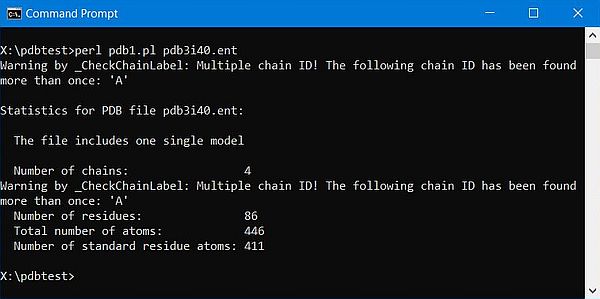
Using the second constructor above works well with molecules with a single chain, however if there are several chains things go wrong (or at least can go wrong). I think that in the latest revision of the legacy PDB format, the ATOM records for all chains precede the HETATM records. I don't know if perhaps this was not the case when ParsePDB was written, the fact is that the functions of the module are not able to deal correctly with this (?). As far as I have understood, sequences and residues are extracted from the the ATOM/HETATM lines, with no difference made between the two record types. In the case, where there are 2 chains A and B, and in the file, we have first the ATOM records of chain A, then B, and then the HETATM records of A, then B, the parse routine detects a Multiple chain ID error. Not enough with that, considering the beginning of a new chain each time that the chain identifier changes, it reports 4 chains instead of 2, and the total number of residues does not correspond to the sum of the lengths of the two chains, as given by the SEQRES records.
The screenshot below shows my first trial to run pdb1.pl using the 2-chain molecule pdb3i40.ent (human insulin, chains A and B, length = 51 amino acids).
 |
There is a simple work-around: Just also ignore the HETATM records (that we mostly don't need), using the constructor
$PDB = ParsePDB->new (FileName => $fileName, NoANISIG => 1, NoHETATM => 1);
After having created the ParsePDB object (let's call it "$PDB"), we use the $PDB->Parse method to actually do the parsing. When this has been done, the different methods of the object may be called to retrieve given information or data. The ParsePDB download archive includes a rather complete documentation in PDF format. Have a look at it in order to understand what the methods called in the programs listed below actually do...
Here is the correctly working code of script sample pdb1.pl.
#!C:/Programs/Strawberry/win64/perl/bin/perl.exe -I.
use strict; use warnings;
use ParsePDB;
(my $fileName) = @ARGV;
unless (scalar @ARGV == 1) {
die "Command line parameter error!\n";
}
my $PDB = ParsePDB->new (FileName => $fileName, NoANISIG => 1, NoHETATM => 1);
$PDB->Parse;
print "\nStatistics for PDB file $fileName:\n\n";
my $modelNumber = $PDB->CountModels;
if ($modelNumber == 1) {
print " The file includes one single model\n\n";
}
else {
print " The file includes $modelNumber models\n";
print " Ignoring all but the first one...\n\n";
}
my $chainNumber = $PDB->CountChains;
print " Number of chains: $chainNumber\n";
my $residueNumber = $PDB->CountResidues;
print " Number of residues: $residueNumber\n";
my $atomNumberTotal = $PDB->CountAtoms;
print " Number of atoms: $atomNumberTotal\n";
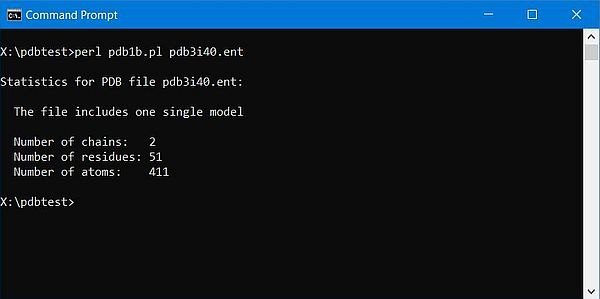
The screenshot below shows the output of the script for the 2-chains human insulin molecule (3i40).
 |
Sample script 2: Chain residues.
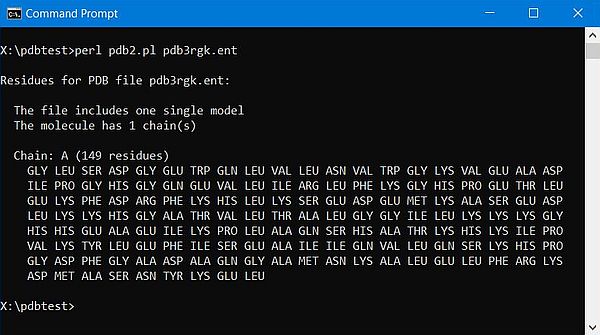
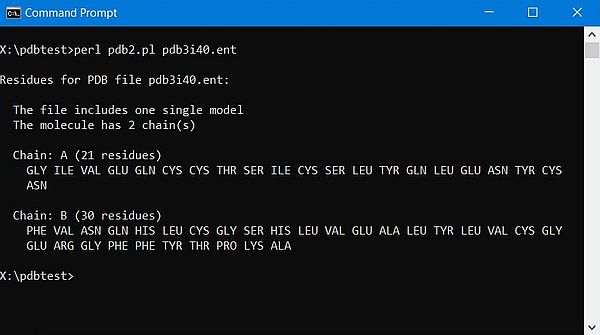
The script pdb2.pl parses the PDB file with the filename entered as command line argument, and prints out the residues for the different chains of the molecule.
The chain identifiers (actually a sequence of integers, starting at 0) are retrieved (into an array) by calling the method $PDB->IdentifyChains. As always, when no parameters are given, the method returns the identifiers for model 0. We can now use the chain identifiers to specify a given chain when calling the methods $PDB->GetChainLabel (returning the label for a given chain, as named in the PDB file), and $PDB->IdentifyResidueLabels (returning the 3-letter residue codes).
Here is the code of script sample pdb2.pl.
#!C:/Programs/Strawberry/win64/perl/bin/perl.exe -I.
use strict; use warnings;
use ParsePDB;
(my $fileName) = @ARGV;
unless (scalar @ARGV == 1) {
die "Command line parameter error!\n";
}
my $PDB = ParsePDB->new (FileName => $fileName, NoANISIG => 1, NoHETATM => 1);
$PDB->Parse;
print "\nResidues for PDB file $fileName:\n\n";
my $modelNumber = $PDB->CountModels;
if ($modelNumber == 1) {
print " The file includes one single model\n";
}
else {
print " The file includes $modelNumber models\n";
print " Ignoring all but the first one...\n";
}
my $chainNumber = $PDB->CountChains;
print " The molecule has $chainNumber chain(s)\n";
my @chains = $PDB->IdentifyChains;
for (my $i = 0; $i < scalar (@chains); $i++) {
my $chainLabel = $PDB->GetChainLabel(Chain => $chains[$i]);
my @residues = $PDB->IdentifyResidueLabels(Chain => $chains[$i]);
my $chainLen = scalar @residues;
print "\n Chain: $chainLabel ($chainLen residues)";
my $c = 0;
for (my $j = 0; $j < scalar @residues; $j++) {
if ($c == 0) {
print "\n ";
}
$c++;
if ($c == 20) {
$c = 0;
}
print "$residues[$j] ";
}
print "\n";
}
The screenshots below show the program output: On the left for the 1-chain human myoglobin molecule (3rgk); on the right for the 2-chains human insulin molecule (3i40).
|
|
Sample script 3: FASTA extraction.
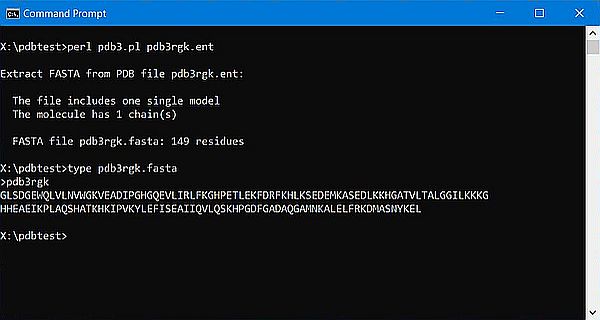
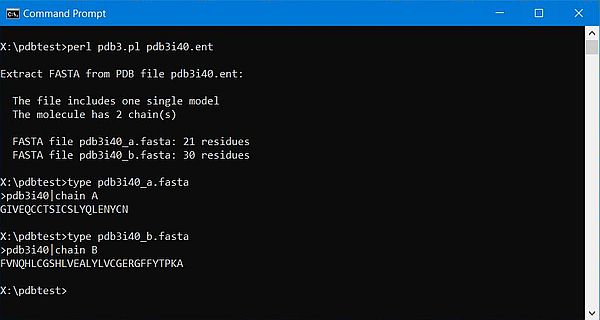
The script pdb3.pl parses the PDB file with the filename entered as command line argument, and extracts the sequences of the different chains of the molecule. It then writes these sequences to one or, in the case where there is more than one chain, to several FASTA files.
The creation of a FASTA file, containing the sequence of a given chain, from a PDB file should be easily done using the $PDB->WriteFASTA method, however, this did not work correctly on my system. I did not succeed to pass a filename to the method and the output filename was an empty string (file created: .fasta) (?). In the case of 2 chains, the first file is thus overwritten by the second one. Also, in this case, the file content is not correct. There are two FASTA header lines, and the sequence is the one of chain A (?). I decided to write the FASTA file manually, using the method $PDB->GetFASTA to extract the FASTA sequences. This didn't work either. Same problem as above (?). So, finally, I do the extraction manually, too, calling $PDB->IdentifyResidueLabels to get the residues for the different chains (just as in the preceding example), then, for each residue, call the method $PDB->AminoAcidConvert to convert the 3-letter code into the corresponding 1-letter code, and finally write these codes to the FASTA file. Here is the source of the script pdb3.pl:
#!C:/Programs/Strawberry/win64/perl/bin/perl.exe -I.
use strict; use warnings;
use ParsePDB;
(my $fileName) = @ARGV;
unless (scalar @ARGV == 1) {
die "Command line parameter error!\n";
}
my $PDB = ParsePDB->new (FileName => $fileName, NoANISIG => 1, NoHETATM => 1);
$PDB->Parse;
print "\nExtract FASTA from PDB file $fileName:\n\n";
my $modelNumber = $PDB->CountModels;
if ($modelNumber == 1) {
print " The file includes one single model\n";
}
else {
print " The file includes $modelNumber models\n";
print " Ignoring all but the first one...\n";
}
my $chainNumber = $PDB->CountChains;
print " The molecule has $chainNumber chain(s)\n\n";
my @chains = $PDB->IdentifyChains;
for (my $i = 0; $i < scalar (@chains); $i++) {
my $chainLabel = $PDB->GetChainLabel(Chain => $chains[$i]);
my @residues = $PDB->IdentifyResidueLabels(Chain => $chains[$i]);
my $chainLen = scalar @residues;
my @fasta = ();
for (my $j = 0; $j < scalar @residues; $j++) {
push(@fasta, $PDB->AminoAcidConvert ($residues[$j]));
}
my $fastaFileName = $fileName;
$fastaFileName =~ s/(\..+)$//g;
my $fastaHeader = $fastaFileName;
if (scalar (@chains) > 1) {
$fastaFileName .= "_" . lc($chainLabel);
$fastaHeader .= '|chain ' . $chainLabel;
}
$fastaFileName .= ".fasta";
open(FASTA, ">$fastaFileName")
or die "Couldn't open file $fastaFileName, $!";
print FASTA ">$fastaHeader";
my $c = 0;
for (my $j = 0; $j < scalar @fasta; $j++) {
if ($c == 0) {
print FASTA "\n";
}
$c++;
if ($c == 80) {
$c = 0;
}
print FASTA "$fasta[$j]";
}
print FASTA "\n";
close FASTA;
my $residueNumber = $PDB->CountResidues(Chain => $chains[$i]);
print " FASTA file $fastaFileName: $residueNumber residues\n";
}
The screenshots below show the program output and the content for the file(s) created: On the left for the 1-chain human myoglobin molecule (3rgk); on the right for the 2-chains human insulin molecule (3i40).
|
|
Sample script 4: 3D structure data.
The script pdb4.pl parses the PDB file with the filename entered as first command line argument, and extracts the 3D structure data for the different chains of the molecule (in fact, it extracts the ATOM records). It then writes this data to one or, in the case where there is more than one chain, to several files, the base of the output filename being given as second command line argument.
To get the ATOM record data, first get all atom identifiers (into an array), using the $PDB->IdentifyAtomNumbers method (specifying a chain identifier as parameter, will return the identifiers for that chain). Then, use the $PDB->Get method with the different atom identifiers as parameters to retrieve the ATOM record for this atom (returned as an array, the elements of which being the different record items).
Note that the script gives the user the possibility to specify the PDB file without extension (the script first searches for a file with extension .pdb, then with the extension .ent). It also checks if the output file already exists, and only overwrites it after user confirmation.
Here is the code of the script pdb4.pl.
#!C:/Programs/Strawberry/win64/perl/bin/perl.exe -I.
use strict; use warnings;
use ParsePDB;
use File::Basename;
my ($fileName, $dataFileName) = @ARGV;
if (scalar @ARGV != 2 or $fileName eq $dataFileName) {
die "Command line parameter error!\n";
}
my ($baseFileName, $fileDir, $fileExt) = fileparse($fileName, '\..*');
unless ($fileExt) {
$fileName = $fileDir . $baseFileName . '.pdb';
unless (-e $fileName) {
$fileName = $fileDir . $baseFileName . '.ent';
}
}
$fileName =~ s/^(\.\\)//g;
unless (-e $fileName) {
die "PDB file not found!\n";
}
$dataFileName =~ s/(\..+)$//g;
my $PDB = ParsePDB->new (FileName => $fileName, NoANISIG => 1, NoHETATM => 1);
$PDB->Parse;
print "\nExtract 3D structure data from PDB file $fileName:\n\n";
my $modelNumber = $PDB->CountModels;
if ($modelNumber == 1) {
print " The file includes one single model\n";
}
else {
print " The file includes $modelNumber models\n";
print " Ignoring all but the first one...\n";
}
my $chainNumber = $PDB->CountChains;
print " The molecule has $chainNumber chain(s)\n\n";
my @chains = $PDB->IdentifyChains;
my $dataFileNameBase = $dataFileName;
for (my $i = 0; $i < scalar (@chains); $i++) {
my $chainLabel = $PDB->GetChainLabel(Chain => $chains[$i]);
my @atoms = $PDB->IdentifyAtomNumbers(Chain => $chains[$i]);
$dataFileName = $dataFileNameBase;
if (scalar (@chains) > 1) {
$dataFileName .= "_" . lc($chainLabel);
}
$dataFileName .= ".pdb";
if (-e $dataFileName) {
print "File $dataFileName already exist. Overwrite (y/n)? ";
my $a = <STDIN>; chomp($a);
unless ($a and lc($a) eq 'y') {
die "Program aborted by user\n";
}
}
open(DATA, ">$dataFileName")
or die "Couldn't open file $dataFileName, $!\n";
for (my $j = 0; $j < scalar @atoms; $j++) {
my @data = $PDB->Get (AtomNumber => $atoms[$j]);
print DATA "@data"
}
close DATA;
print "3D structure file $dataFileName created\n";
}
The screenshot on the left shows the program output for the 2-chains human insulin molecule (3i40). The screenshot on the right shows the beginning of the output file for chain A.
![ParsePDB.pm: Script sample - Extracting the 3D structure data for human insulin (3i40) [1] ParsePDB.pm: Script sample - Extracting the 3D structure data for human insulin (3i40) [1]](../screenshots/pdb11a.jpg)
|
![ParsePDB.pm: Script sample - Extracting the 3D structure data for human insulin (3i40) [2] ParsePDB.pm: Script sample - Extracting the 3D structure data for human insulin (3i40) [2]](../screenshots/pdb11b.jpg)
|
Visualizing 3D molecule structures.
The primary information stored in the PDB archive consists of coordinate files that list the atoms in each structure and their 3D location in space, along with summary information about the structure, sequence, and experiment. Several methods are currently used to determine the structure of a protein, including X-ray crystallography, NMR spectroscopy, and electron microscopy. For details about these methods, have a look at the article Methods for Determining Atomic Structures at pdb101.rcsb.org.
As we saw before, in PDB files, the information about the 3D structure of the molecules are stored in the ATOM (and HETATM) records. There is an ATOM record for each atom that is part of the molecule. Each of these atoms is identified by a sequential number in the entry file, a specific atom name, the name and number of the residue it belongs to, a one-letter code to specify the chain, its x, y, and z coordinates, and an occupancy and temperature factor. These values may not be meaningful for us, but for molecule visualization software they are all that is needed to draw an image of the molecule structure. You can find some general concepts about atom coordinates and molecule visualization programs in the article Dealing with Coordinates at pdb101.rcsb.org.
There are several free molecule visualization programs available for free on the Internet. This tutorial uses Jmol, "an open-source Java viewer for chemical structures in 3D with features for chemicals, crystals, materials and biomolecules"; click the following link to visit the Jmol website at Sourceforge, where you can download the software (I actually use version 16.2.1). You can find lots of useful information about Jmol in the Jmol Wiki. Finally, there are also some books in PDF format on the Net, in particular Exploring Proteins and Nucleic Acids with Jmol, by Jeffrey A. Cohlberg (California State University, Long Beach), that presents the software as a tutorial and that will without any doubt be a great help in order to use this nice piece of software.
Jmol is a Java application, what makes it platform independent, but, of course, requires that you have Java installed. I actually use OpenJDK Platform 21. Other 64-bit Java distributions and versions should also work (note that, unless you intend to develop Java applications, you may want to install a JRE, instead of the JDK).
The Jmol download archive consists of the application folder structure, that you can copy to a wherever you want directory (I chose C:\Programs\Jmol). The main executable is jmol.jar. For your own convenience, you should create a shortcut on your desktop or in the Windows Start menu. The archive also contains JSmol a Javascript version of Jmol for the web browser. I did not succeed to run this application, because of a script error (?).
Jmol is not difficult to use, but it is really huge. There are innumerable topics that you can explore, with lots of options how to display the molecule. In the following paragraphs, I will describe some general usage information, and show some concrete display examples.
Molecule visualization software like Jmol understands several file formats, in particular PDB files. The ATOM (and HETATM) records of these files are all that the visualization software needs to draw the molecule. When I searched the Internet for molecule files, I found a ZIP file with small molecule files with extension .pdb. They are obviously no valid PDB files (as defined by the Protein Data Bank standard), but just contain ATOM and HETATM records (sometimes also a COMPND record). Obvious that protein related software can't deal with these files, but for Jmol and similar this is all ok. As example here is the content of a file, called water.pdb:
COMPND Water
HETATM 1 O 1 0.251 -0.360 -0.046 1.00 0.00
HETATM 2 H 1 0.249 0.684 0.231 1.00 0.00
HETATM 3 H 1 0.586 -0.954 0.791 1.00 0.00
TER 4 1
END
The screenshot shows the file water.pdb opened in Jmol.
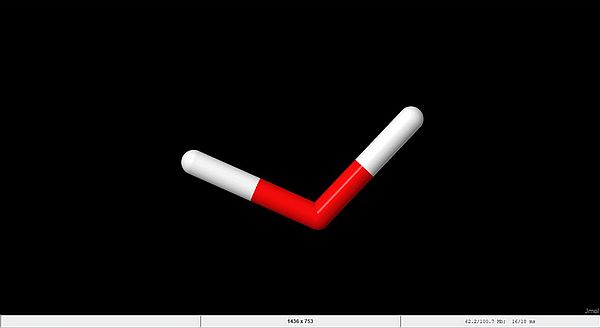 |
That might not be what you expected. In fact, with this default style scheme, called Stick, only the bonds, but not the atoms are displayed. We'll see a little bit further down how to change this.
Jmol allows you to move the molecule around on the screen, to zoom in or out, as well as to rotate it in all 3 planes. All this may be done using the mouse as follows:
- To rotate the molecule in the X and Y directions, left-click on the molecule and drag it to the left or right (X direction), resp. up or down (Y direction). To rotate the molecule in the Z direction (in the plane of the screen), hold down the Shift key and move the mouse to the left or right.
- To move (translate) the molecule, hold down the shift key, double-click on the molecule, holding the mouse button down on the second click, and drag the molecule in either direction to a new position on the screen.
- To zoom in or out, hold down the Shift key, left-click on the molecule, and move the mouse up to zoom out or down to zoom in.
- To reset the molecule to its original position, view angle and size, hold down the Shift key and double-click.
For most displays, using the "right-click menu" (menu that opens when doing a right-click with your mouse) and choosing the Jmol commands from this menu is the most convenient way to proceed. Let's try the following: Style > Scheme > Ball and Stick. That's more what you thought how the molecules would look like, isn't it?
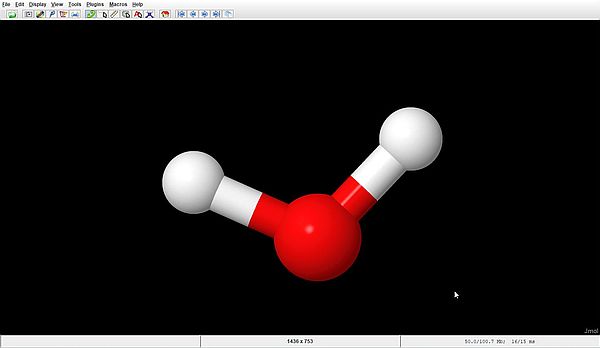 |
With this style scheme, we well recognize the oxygen atom (in red) and the two hydrogen atoms (in white). Also note the half red, half white coloration of the bonds between O and H. Now, becomes clear what the display seen before actually means.
We can adapt the display with this style scheme to our wishes; for example: Style > Bonds > 25 Å makes the bonds thicker, Style > Atoms > 50% van der Waals makes the atoms larger.
If no custom coloration is specified, the Corey-Pauling-Koltun scheme is used. For the atoms, colors are as follows:
| Atom | Color |
|---|---|
| carbon (C) | gray |
| hydrogen (H) | white |
| oxygen (O) | red |
| nitrogen (N) | blue |
| sulfur (S) | yellow |
| phosphorus (P) | orange |
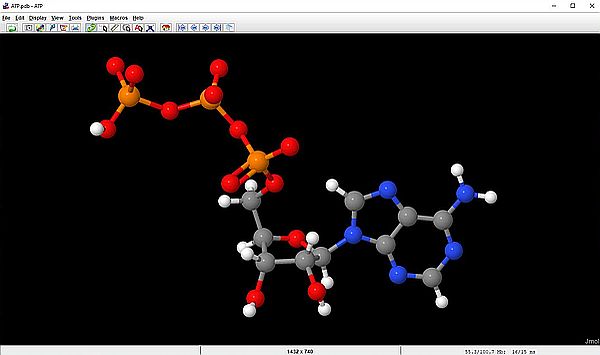
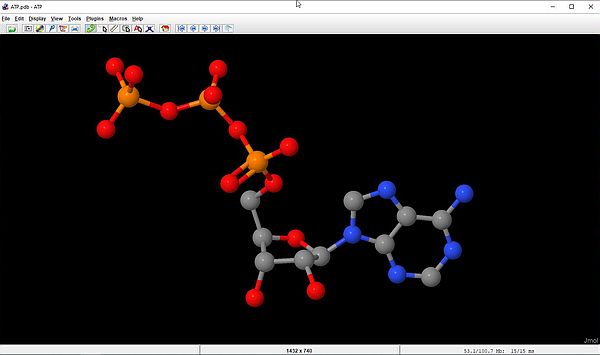
Often, especially for big molecules, some of the molecule's atoms may hide some others atoms. Displaying the molecule as Ball and Stick, but hiding the hydrogen atoms is often helpful to get a better display. This is done by unselecting the Style > Scheme > Atoms > Show Hydrogens checkbox (right-click menu). The screenshots show the famous ATP molecule with the hydrogen atoms displayed (on the left), and without the hydrogen displayed (on the right).
|
|
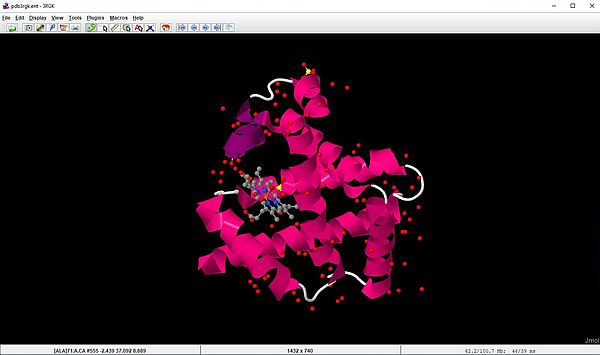
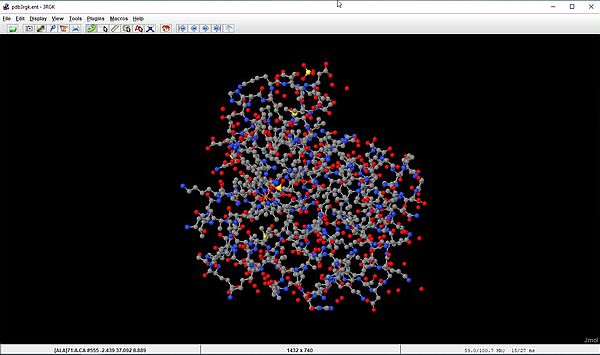
The screenshots below show the human myoglobin molecule (3rgk), that we downloaded in the first section of the tutorial. The file is opened with the display shown on the screenshot on the left. This corresponds to the Cartoon style, that shows the alpha helix as a twisted ribbon colored magenta. The screenshot on the right shows the molecule using the Ball and Sticks style scheme.
|
|
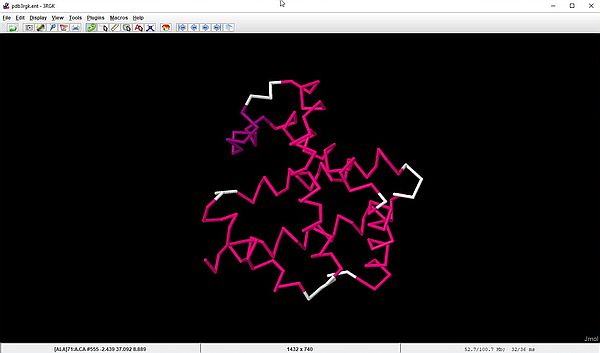
For macromolecules like our myoglobin, displaying only the molecule backbone is often a good choice. With the command Style > Structures > Backbone the molecule is shown as straight lines connecting the alpha carbon atoms.
 |
Until now, we have entered the Jmol commands by choosing some items from the menu bar, or the right-click menu. This is the easiest way for simple displays. If we want to show more specific features using all custom settings, working in the Jmol Script console is often the best way to proceed. To open the console on the desktop, choose File > Console. The blue lines in the upper part of the console window describe the molecule actually displayed. The lower part (with the "$" prompt) allows to enter commands using a simple language that is easy to learn. Visit the Jmol/JSmol interactive scripting documentation webpage for details about the Jmol Scripting Language.
Commands are normally entered one command per line and terminated by hitting the ENTER key. You may, however, type several commands on one line, separating them with a semicolon (;).
Some examples: Suppose that our molecule is displayed using the Ball and Sticks style scheme. To display the alpha helix (letting the balls and sticks displayed), type ribbon (the ribbon will be displayed in gray here). To display a smaller ribbon, type something like ribbon 200. To display the ribbon without the balls and sticks, type ribbon only. If we want to display the backbone at this point, we have first to make disappear the ribbon: ribbon off, then we can type backbone. A quicker alternative is to type backbone only. The backbone displayed here is in gray and the lines are very narrow. To get larger lines, use something like backbone 100.
If you are a little bit used with the Jmol scripting language, you can easily display all that you want in exactly the way that you want it to look like. Example: To
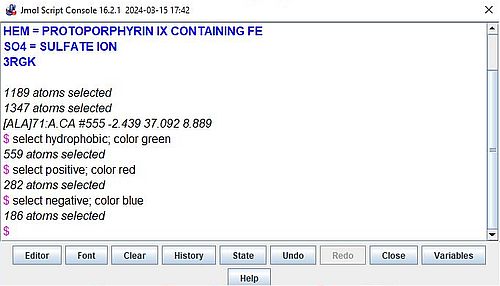
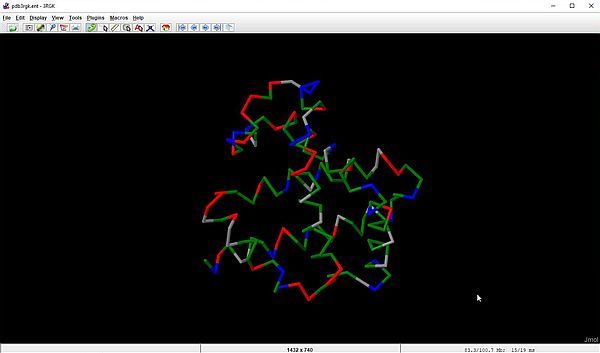
display hydrophobic amino acids in green, positive amino acids in red, and negative amino acids in blue, use the following commands:
select hydrophobic; color green
select positive; color red
select negative; color blue
The screenshot shows these commands in the Jmol Scripting Console.
 |
And here is the screenshot showing the output of the script.
 |
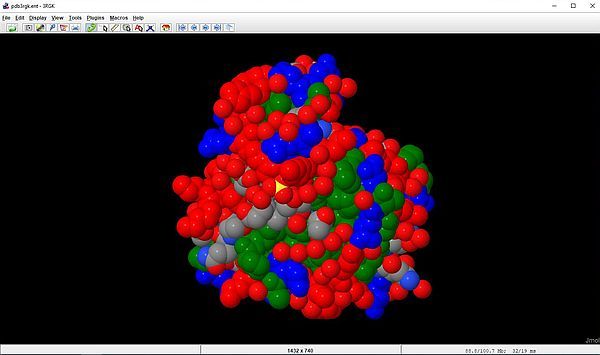
In the following example, we will do the same selective coloring as before, but display the molecule using the Spacefill style scheme. This
scheme displays each of the atoms as a sphere with a radius equal to the van der Waals radius of the atom. Selected from the right-click menu, the Corey-Pauling-Koltun
color scheme is used. In our example, atoms will have a color in relationship with the type of amino acid that they belong to. Here is the script:
select hydrophobic; color green
select positive; color red
select negative; color blue
select all; spacefill
And the result of the script.
 |
Here is another example. We have seen that human insulin is made of two chains A and B. How do we proceed to show the two chains, by displaying them each with its own color? Using the console would probably be the way chosen by people who are used to work with molecule visualization software. But, this is a case, where doing the selections from the right-click menu is rather simple. Just choose Color > Structure > Backbone > By Scheme > Chain. The screenshot on the left shows the backbone of the molecule 3i40, and the selections to do in the right-click menu. The screenshot on the right shows the molecule, each of the two chains having its own color.
![Jmol: Human insulin (3i40) - Selective coloring of the 2 chains [1] Jmol: Human insulin (3i40) - Selective coloring of the 2 chains [1]](../screenshots/pdb20a.jpg)
|
![Jmol: Human insulin (3i40) - Selective coloring of the 2 chains [2] Jmol: Human insulin (3i40) - Selective coloring of the 2 chains [2]](../screenshots/pdb20b.jpg)
|
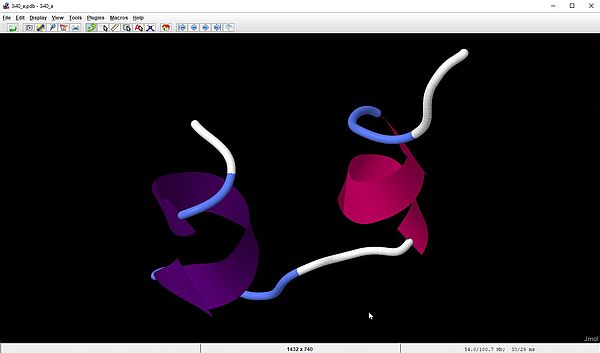
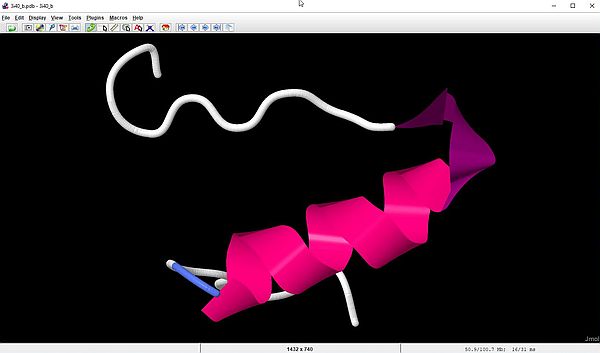
With the last script sample in the section about parsing PDB files with Perl, we have extracted the ATOM records of chain A and B of the 3i40 molecule. As Jmol does support such "bad" PDB files and can display the molecule structure using just those records, lets have a look at the individual display of the A and B chains. The screenshot on the left shows the Jmol output for our file 3i40_a.pdb (chain A); the screenshot on the right shows the output for 3i40_b.pdb (chain B).
|
|
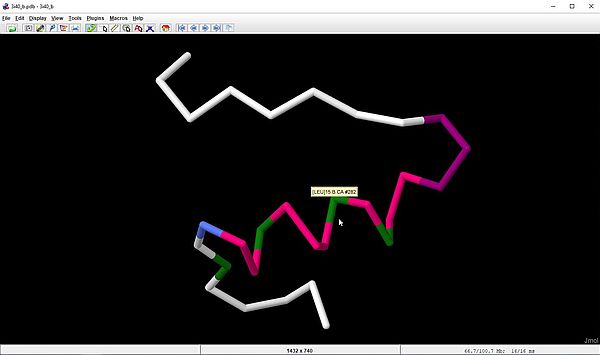
And here is a last example. The chain B of human insulin has 4 leucine residues. How do we proceed to show the position of this amino acid, by displaying it using a specific coloration? To do this, we have to take two steps: First, selecting the amino acid, then setting the color scheme. From the right-click menu, choose: Select > Protein > Residue by Name > LEU. The leucine amino acids being now the only part of the molecule selected, the "amino acid" color scheme will give all leucine residues a specific color. To apply the color scheme, choose: Color > By Scheme > Amino Acid. Here is the display in Jmol (backbone of the molecule).
 |
If you find this tutorial helpful, please, support me and this website by signing my guestbook.