Grapher - A function/data plotter and spreadsheet application all in one.
Grapher, by Golden Software, can be used to plot mathematical and other functions by entering their formula. You can also use it to plot the graph defined by a series of x-y-values contained in a file. Particularly useful in this context, you can use Grapher to determine the linear, logarithmic or polynomial fit to a series of data points. But, that's not all: Grapher also is a complete spreadsheet application, allowing to enter text, shapes, data, formulas, equations, and of course, you can use the spreadsheet content to create graphs.
Grapher 1.32 is available for download on the VetusWare website. The download archive contains the file structure of the application. I unpacked the archive on my Windows 10 into a folder called "Graf4Win" that I transferred to my Windows NT4 VMware Workstation 16 virtual machine using an USB stick.
Note: On the VetusWare website, they write that Grapher may be run on Windows 3.11 (maybe also Windows 3.1 and even Windows 3.0). I did not try this out...
On my Windows NT computer, I copied the folder Graf4Win" to C:\. If you use another path, please consider the following: 1. the path must be made of short (i.e. maximum 8 characters) file names; 2. you'll have to adapt the path in the file Graf4win.ini.
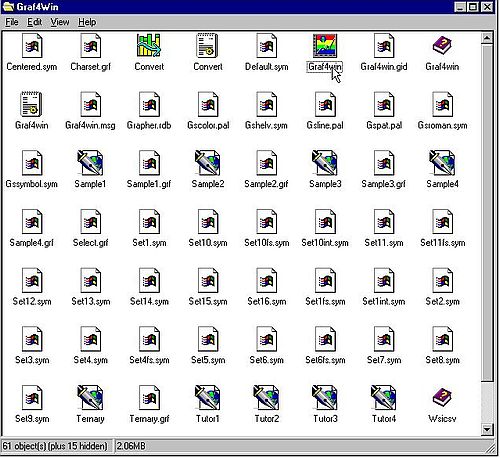
The screenshot below shows the content of C:\Graf4Win, opened in Windows NT4 File Explorer. The main executable is called Graf4win.exe.

|
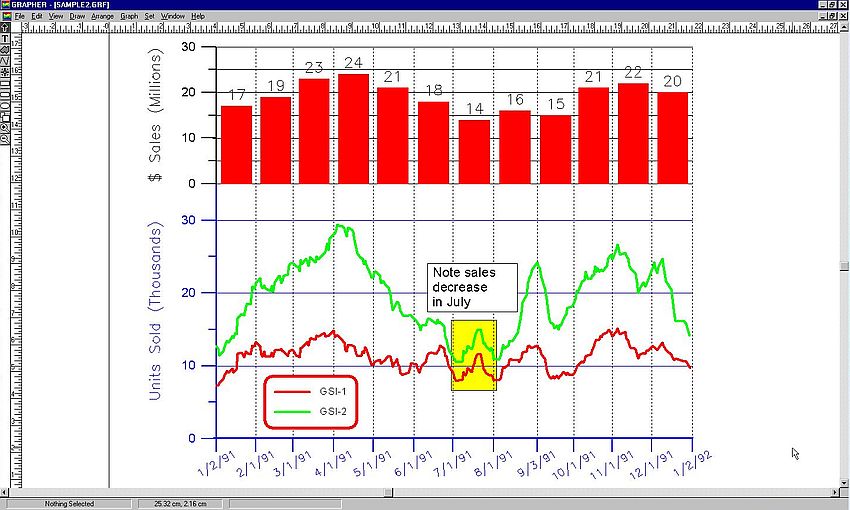
The installation files include some examples; use File > Open from the menu to open the graphs (.grf files). Two of them are shown on the screenshots below. That looks really nice, doesn't it?

|

|
Double-clicking in the region of a curve will open the property window for that curve, allowing to adapt the curve to your needs and wishes.
To open a spreadsheet, choose File > Worksheet from the menu and select the spreadsheet (.dat file) that you want to open. To create a new spreadsheet, choose File > New from the menu and then select Worksheet.
To plot a function, choose File > New from the menu and then select Plot. Finally, from the menu, choose Graph > Function. This opens the Functions window, where you can enter the function equation (Cartesian or parametric form), as well as set the plot parameters, such as first x, last x, number of steps, increment, and others.
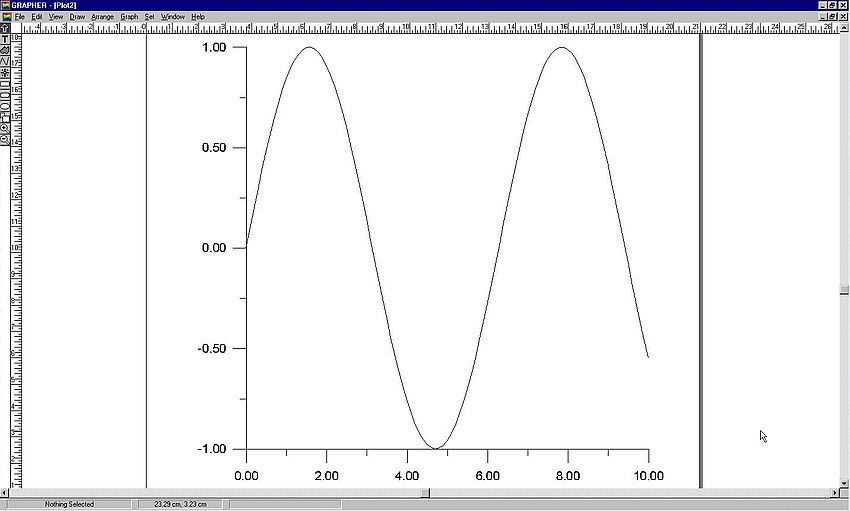
The screenshot below shows the plot of the function y = sin(x) with all default parameters.

|
If you like this page, please, support me and this website by signing my guestbook.